Chart View |
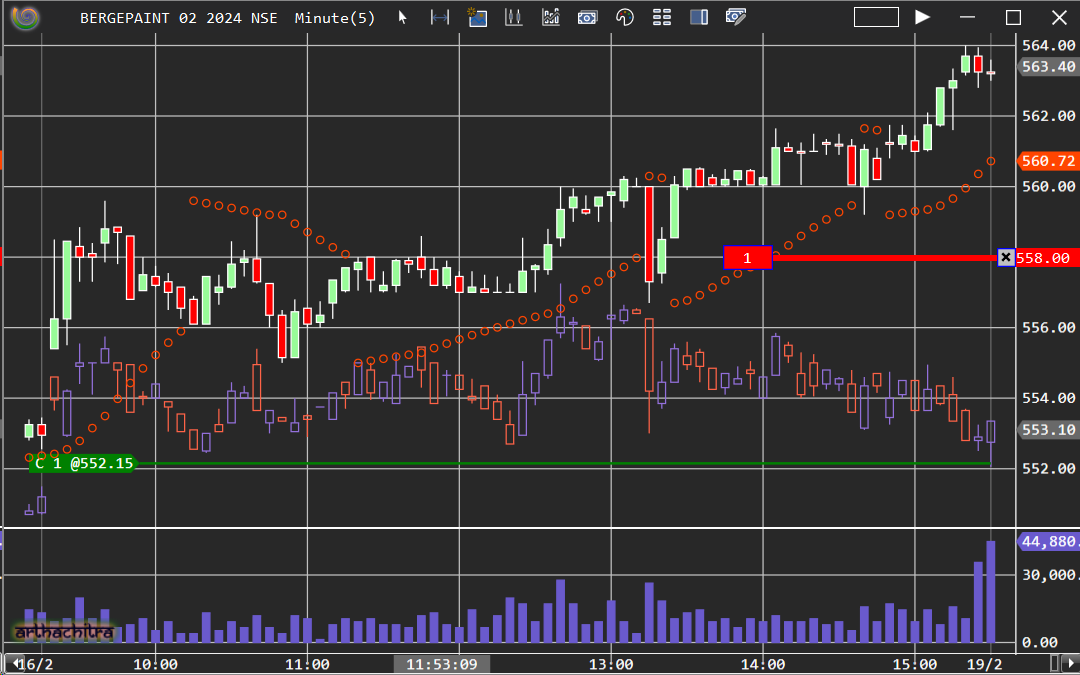
ArthaChitra has an advance charting interface which not only provides advanced analytical features but also acts as an order routing platform having innovating order routing features.
ArthaChitra supports both equi-distant and time based x-axis. While an equi-distant chart simply stacks the bars one after another, a time based x-axis plots the bars based on their time value. A time based x-axis lets one to plot multiple bars in a single view. This can be in combinations of any periodicity or instruments.
For example, you can plot a 1 (one) minute and 3 (three) minute bar on a same chart. You can also plot 2 (two) or more chart of different instrument on the same chart. For example you can plot a 5 (five) minute bars of the Nifty Index and 3 (three) minute bars of the Nifty futures chart
ArthaChitra natively comes with a bouquet of popular indicators and drawing objects. User can also custom code their own bar type, indicator, drawing objects and other business objects.
Some of the salient features of ArthaChitra includes:
Ability to plot multiple bars on a single chart. The combination of bars can of any instrument or any time-frame.
Apply popular indicators, including ability to plot indicator based on different bars series e.g. ArthaChitra can plot a SMA based on say 5 minute bars over a 1 minute bars. You can also plot an indicator based on a different instrument. For example, your chart can be of the underlying, however the indicator can be its corresponding futures.
Linear and logarithmic chart
70+ popular in-built indicators, beside ability to code custom indicators, drawing objects and other business objects.
Drawing objects like Fibonacci retracements, Gann Fan, Andrawes Pitchfork etc
One click order placement directly from charts, including ability to submit OCO orders at a click of a button.
Please find below the workings of the tool bar items
- Instrument drop down menu items - Change chart instruments using the Instrument drop down menu item.
- Periodicity drop down menu items - Change the periodicity of the using the periodicity drop down menu items.
- Change the mouse type, from the default pointer or the cross hair mouse type
- Increase or decrease bar width, bar space
- Screenshot menu item - Take a screenshot of the chart. The screenshot is saved in the folder <My Documents>\ArthaChitra 2\Screenshot\
- Drawing object drop down menu - Draw a drawing object like line, shapes, Fibonacci retracements etc.
- Opens the Data Series dialog
- Indicator selector menu item - Apply an indicator or edit existing indicators.
- Strategy selector menu item - Apply a strategy.
- Opens the DataBox View to view the OHLC values of the bars or the series values of the indicator(s).
- Show or hide the chart trader panel
- Place limit orders at mouse position.
You can invoke the context menu by right-clicking on the Dom View. Please find the workings of the default context menu items
| 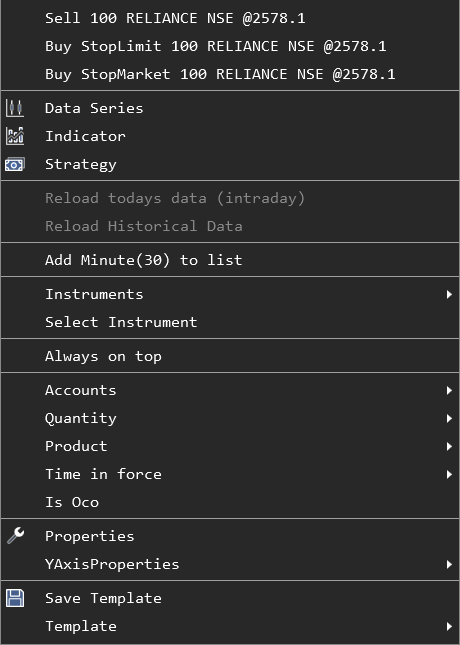 |