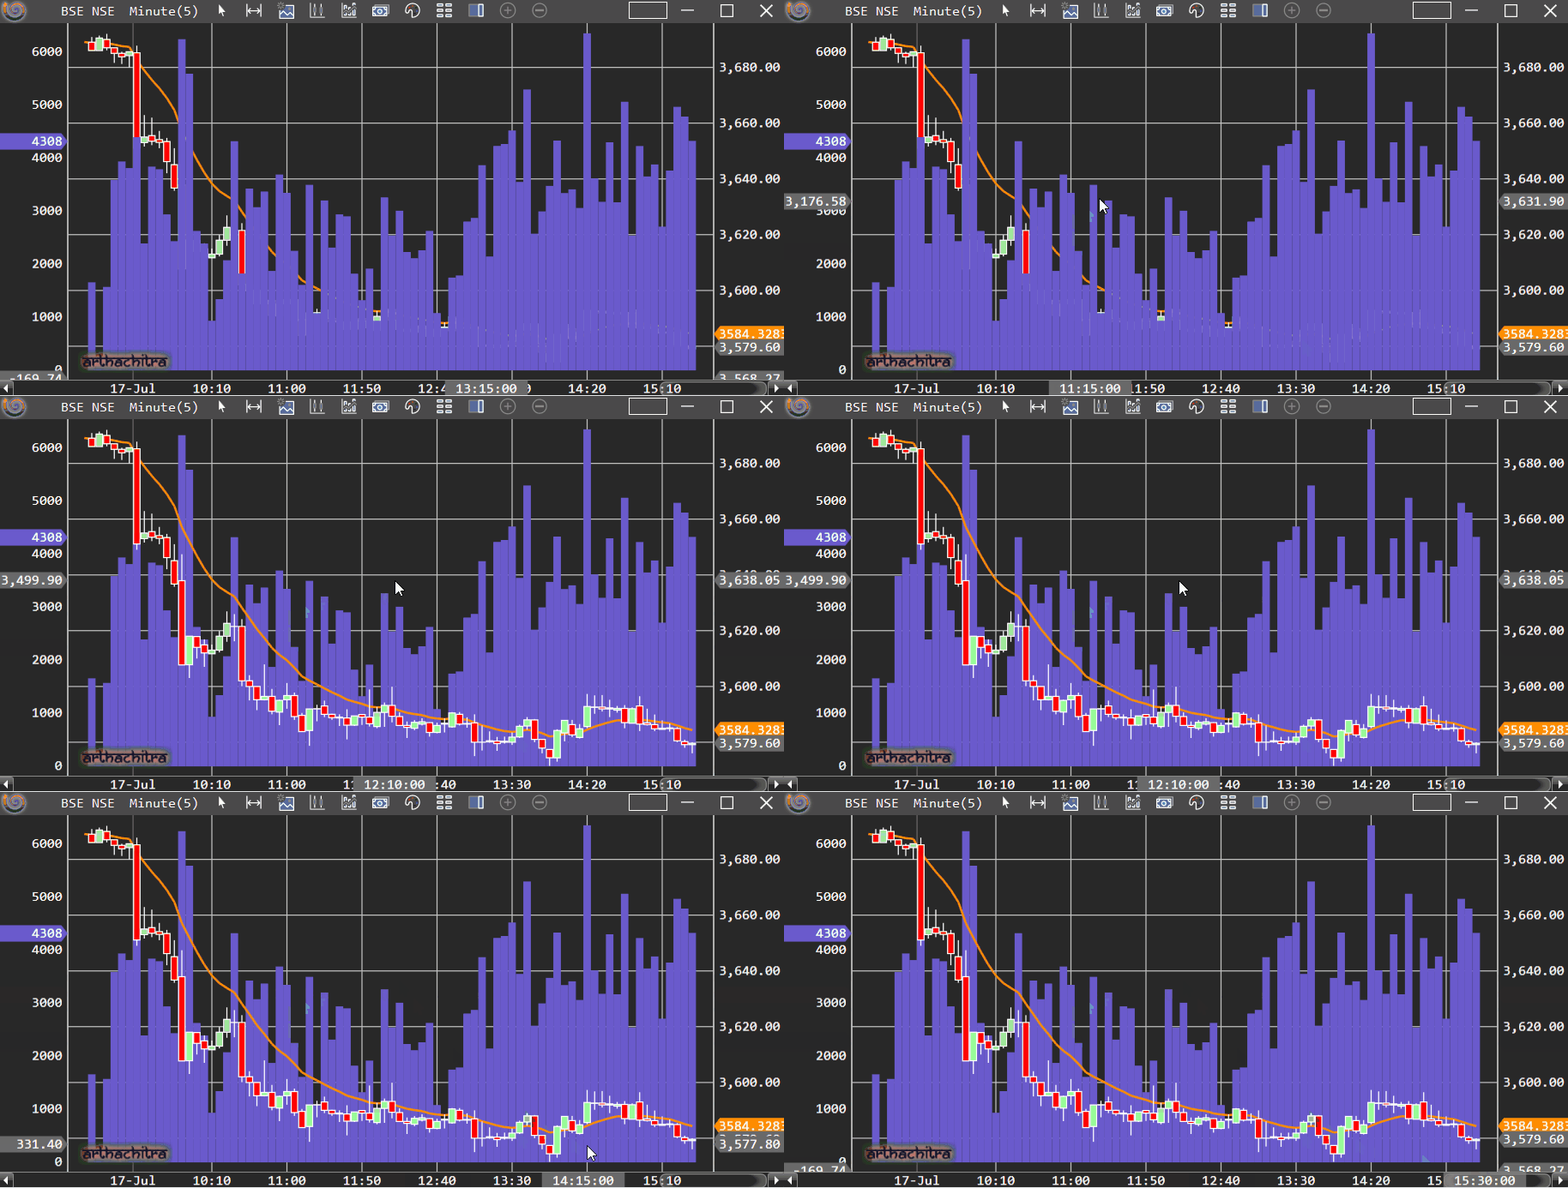
How to navigate the chart |
The charts are highly flexible and can be customized extensively. Please find below some of the chart features:
 How to change the Y-Axis scale type
The Y-Axis scale can be linear or logarithmic. To change the scale type please follow the below steps:
Right click on the chart, and in the context menu goto Y-Axis properties > {Left/Right} Y-Axis
In the YAixs properties dialog, set an appropriate value in the 'Scale Type' parameter
Click Ok to apply the changes
How to change the Y-Axis orientationThe Y-Axis can be oriented both on the right or left side of the chart. In addition one can also overlay the visual. In such scenario the Y-Axis wont be visible.
In the Bar Selector View or the Indicator/Strategy Selector View, select the visual object
In the visual parameters on the right, set an appropriate value in the parameter 'Y-Axis orientation'
Note : The Y-Axis are shared by multiple visuals (bars, indicator, etc)
How to change the vertical scale of the chartThe Y-Axis values automatically adjusts as user scrolls the charts or with each incoming ticks. User can however change the Y-Axis values on the fly. To change the Y-Axis values, please follow the below steps:
To scroll the Y-Axis please follow the below steps:
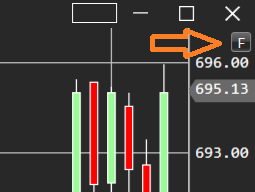
Note: Press the [F] button on the Y-Axis to reset back to automatic scaling You can also change the Y-Axis minimum and maximum values from the Y-Axis properties:
|  |
How to scroll the chart horizontallyUser can scroll the chart horizontally by dragging the scroll bar. The scroll bar is placed directly on top of the X-Axis. User can also place the mouse on the chart and rotate the mouse wheel to scroll the chart horizontally. Note : Automatic scrolling with each new incoming real-time ticks will stop if you navigate to historical bars. You can always reset to automatic scrolling by pressing the [>] button on the top right chart. | 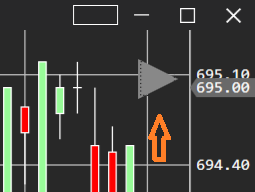 |
How to change the bar space and bar widthThe bar space and bar width can be changed using the key board shortcuts as defined below:
Keyboard shortcut to change bar space
Increase bar space - Ctrl + Up arrow key
Decrease bar space - Ctrl + Down arrow key
Keyboard shortcut to change bar width
Increase bar width - Alt + Up arrow key
Decrease bar width - Alt + Down arrow key
Changing the Z-Order of the visualsZ-Order determines the front-to-back render order of the visuals. The z-order can be changed by pressing the Shift Key and rotating the mouse wheel.