Market Scanner View
|
|
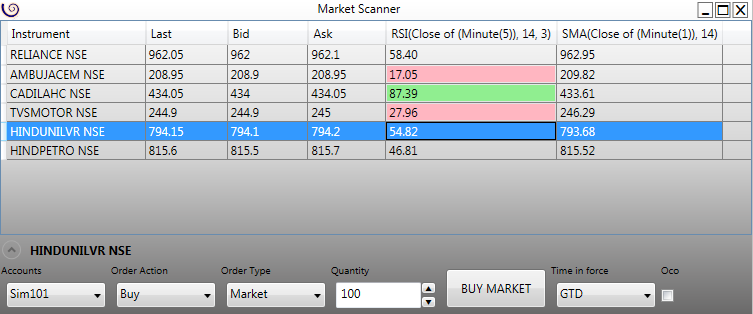
The Market Scanner is an advanced view which lets one to take a closer look at
the market. One can add different metrics to get an in-depth analytical view of
the market. The Market Scanner View can be
|
|
 |
|
|
|
|
|
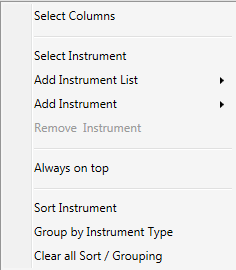
The context menu can be invoked simply by right-clicking on the Market Scanner
View. The context menu items are as follows:
- Select the columns you want to display
- Select Instrument
- Select an Instrument List
- Select Instrument from Instrument List
- Remove any selected Instrument
- Always on top
- Sort Instrument by DisplayName
- Group Instrument by InstrumentType
- Clear sorting grouping
|
 |
|
How to add Indicator column
|
|
|
|
|
|
 |
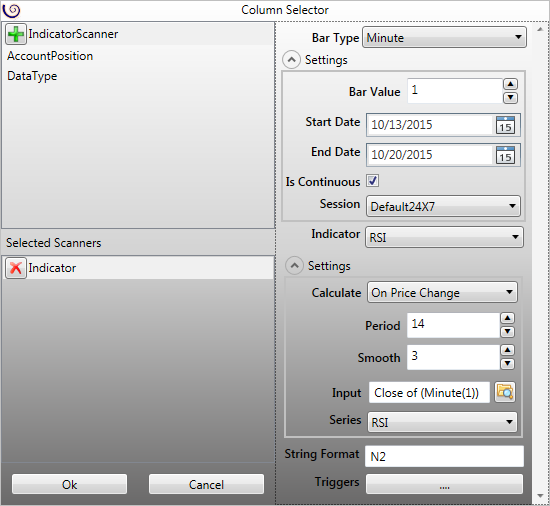
You can add an indicator and view the values of the selected series. The values
are updated in real-time and is a great way to scan the market metrics as it
unfolds.
- Select the Indicator Scanner from the top left listbox and click on the Add
button to add the indicator scanner.
- In the Selected Scanner listbox, select the newly added scanner.
- On the right pane, select the BarType (on which the indicator will be based on) and the Indicator which you intend to
apply.
- To configure the number of decimals the series value will display you can specify a string format
- If you want to change the cell background color on certain conditions, then you
can do so by adding triggers. Please refer to the section Applying Conditions
for more details.
|
|
|
|
|
|
Applying conditions
|
 |
|
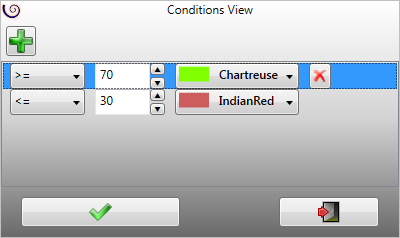
If you want to change the background color when the indicator series matches
some value then you can do so by adding a trigger.
- Click on the Add button add a new trigger.
- Select a condition from the Condition drop down
- Select a value
- Select the background color you want to apply.
|
|