|
Chart View
|
|
|
|
|
|
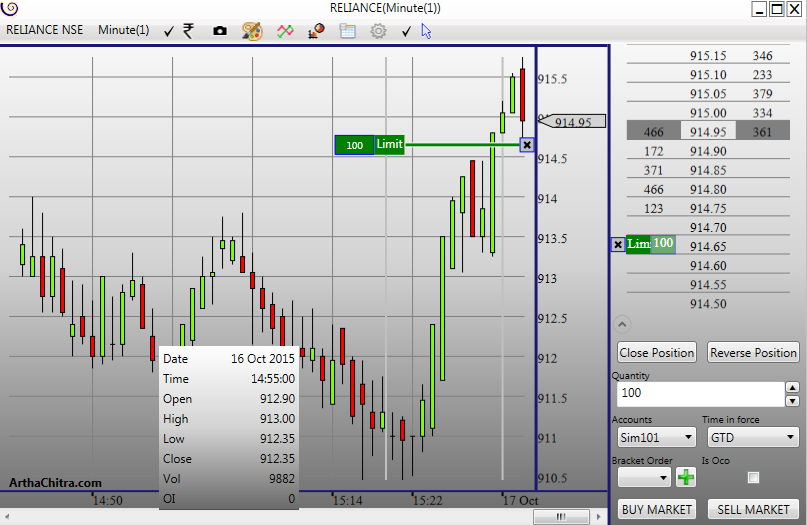
The Chart View not only displays charts but is also an efficient order entry
system. You can place orders via the chart or the Dom linked with it, and can
modify orders by simple drag and drop operations.
|
|
|
|
 |
|
|
|
Below
please find the functionalities as found in the menu bar
- Instrument drop down menu items - Change chart instruments using the Instrument
drop down menu item
- Periodicity drop down menu items - Change the periodicity of the using the
periodicity drop down menu items.
- Enable/disable chart trader menu item - Enables or disables the Chart Trader
- Screenshot menu item - Take a screenshot of the chart. The screenshot is saved
in the folder <My Documents>\ArthaChitra 1\Screenshot\
- Drawing object drop down menu - Draw a chart object
- Indicator selector menu item - Apply an indicator or edit existing indicators
- Chart Style menu item - Change the Chart Style of the bar
- Bars data view menu item - Displays the current bars data
- Chart properties menu item - Displays the chart properties view
- Enable/disable hittest/mouse menu item - Enables or disables the mouse hit test
|
|
The Chart Trader
The chart trader incorporates a Dom view. The basic functioning is similar to
the dom view. Please click here to know more about the Dom View
Note: The Dom View properties like Font, Grid Color etc are inherited from the
Chart Properties only.
|
|
|
The Data Box
Middle mouse click will bring up the data box. On the Bars panel it will display
the Time, Open, High, Low, Close, Volume and OI info. In addition if there are
any indicators applied, it will also display the indicators series values. On a
non-bar panel it will only show the applied indicators series info.
|
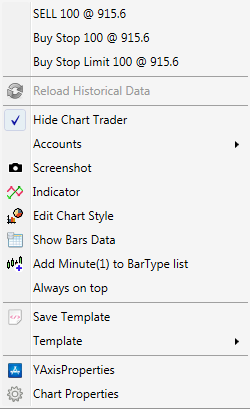
Right click anywhere on the chart view to open the chart view context menu as
shown in the screenshot on the right.
- The first 3 menu items pertains to buy/sell. One can place a buy or sell limit
order, buy/sell stop limit order and buy/sell stop market order. Whether the
order will be buy or sell depends on where you have right clicked on the chart.
If you have clicked below the last traded price, the menu items will don Buy
limit order and Sell stop orders and vice-verse. Please note, the menu
item will pop up only if you are connected and your connection provider supports
order submission. Again if the connection does not support a particular
orderType then that menu item will not appear. For example NOW connection does
not supports stop market orders. As such the menu items will not show the stop
market items.
- Reload Historical Data - If your connection supports historical data, then you
reload the data using it.
- Enable/disable the chart trader.
- Select the account you want to trade.
- Take a screenshot of the chart view.
- Opens the Indicator selector view
- Opens the Chart Style selector view
- Opens the bars data view
- Adds the current charts BarType to the Periodicity dropdown menu.
- Sets the charts view as topmost
- Save the applied indicators as a template.
- Apply saved templates in the current chart.
- Opens the Y Axis properties view
- Opens the chart properties view
|
 |
|
|
|
|